Live Performance Metrics

If You Can Measure It, You Can Improve It

What if you could see your internal states in real time? The Live Human Performance Dashboard makes the invisible observable—transforming heart-brain coherence, stress recovery, and emotional regulation into measurable, actionable data.

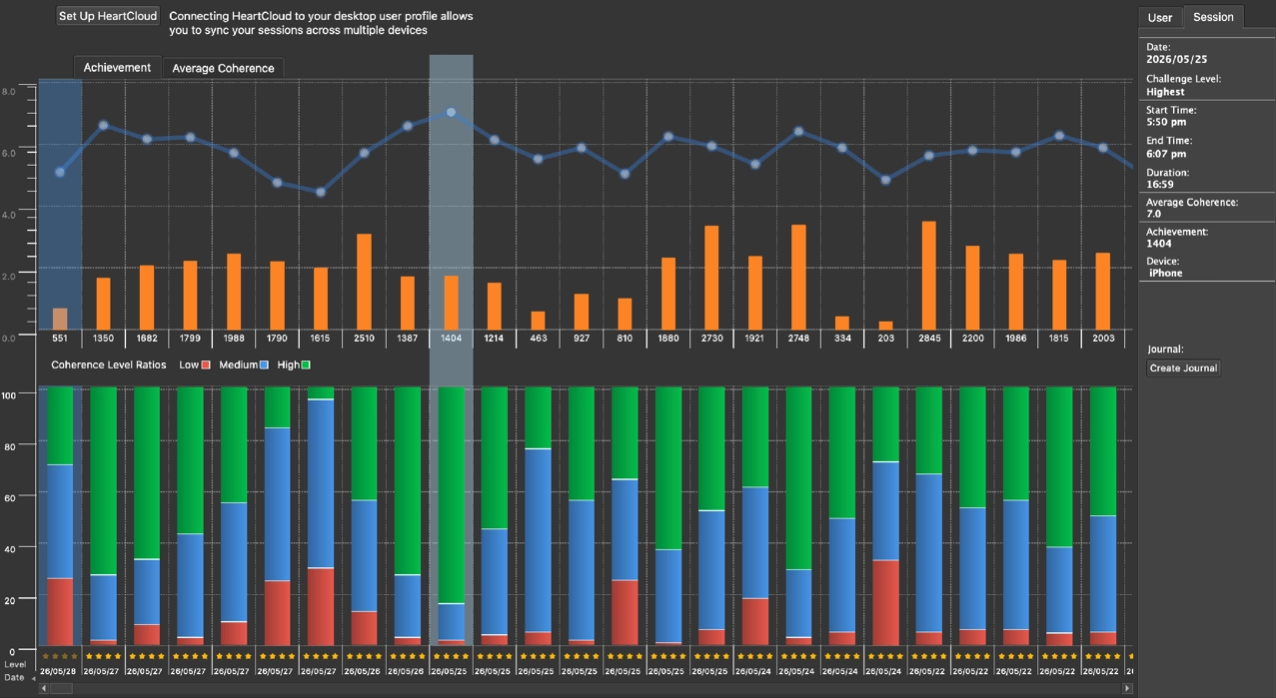
Example of real-time heart-brain coherence visualization

Illustrative example - actual sessions use your live biometric data
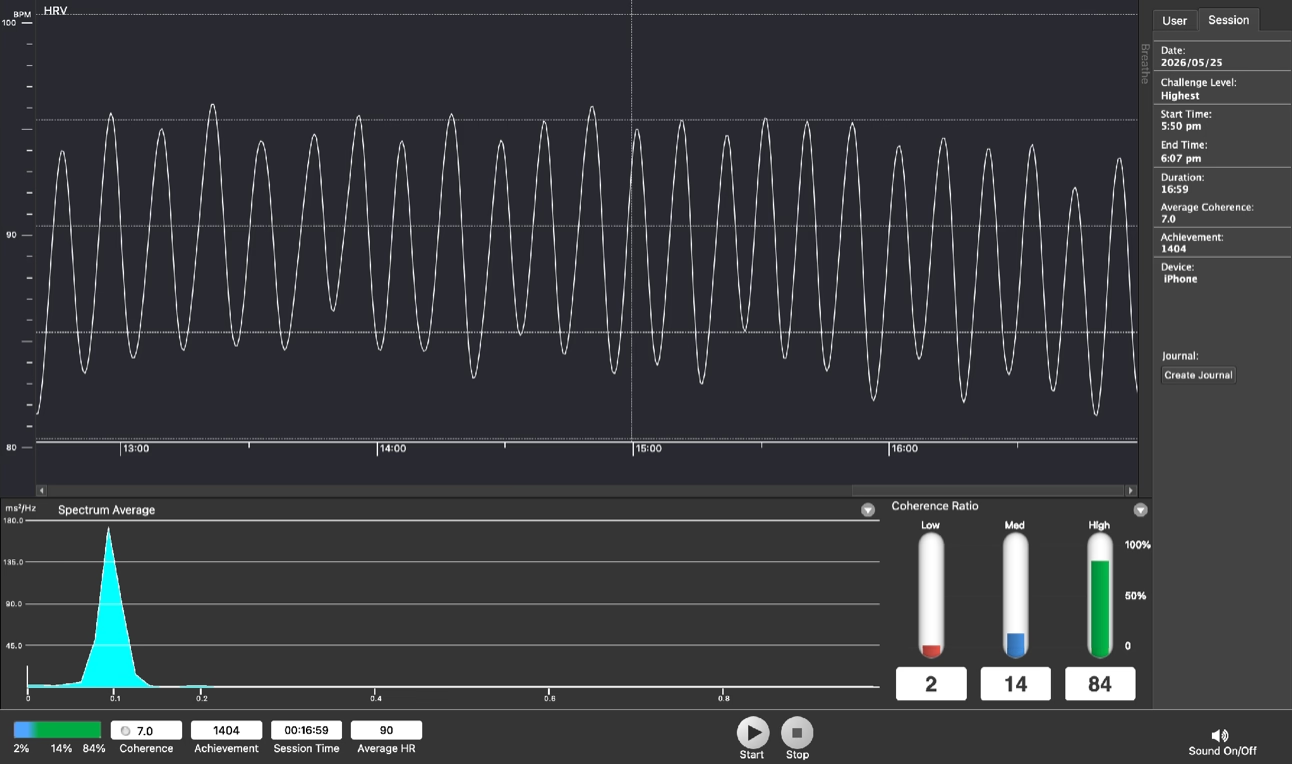
Example of performance analytics interface

Illustrative example - actual sessions use your live biometric data

Making the Invisible Observable

Your internal states—heart-brain coherence, stress responses, emotional regulation—are normally invisible. Real-time biofeedback transforms these hidden processes into observable data.

During live sessions, we use your actual physiological data to track progress and guide development. What you see here demonstrates the principle—when we work together, you'll see your own metrics in real time.

Measure

Heart-Brain Coherence

Real-time synchronization between heart rhythm patterns and brain activity.

Emotional Regulation

Track your ability to maintain emotional balance under pressure.

Stress Recovery

Measure how quickly your nervous system returns to baseline after stress.

Physiological Resilience

Assess your body's capacity to adapt and thrive under challenge.

Individual Progress

Personal development metrics tracked over weeks and months.

Team Progress

Collective coherence and performance trends across teams.

Organisational Trends

Enterprise-wide insights into culture, resilience, and performance.

Development Becomes Observable Over Time

The Live Human Performance Dashboard transforms invisible internal development into visible, measurable progress.

What was once subjective—emotional regulation, stress resilience, coherence—becomes objective. Patterns emerge. Trends become clear. Development is no longer a matter of belief or perception. It becomes data.

When individuals can see their progress in real-time, motivation increases. When teams can track collective coherence, accountability strengthens. When organisations can measure cultural shifts physiologically, transformation becomes strategic.

You can't improve what you can't measure. And you can't measure what you can't see.

The dashboard makes the invisible visible.

Traditional programmes measure attendance.

We measure development.

Key Benefits

5 Benefits of Real-Time Performance Tracking

The Live Human Performance Dashboard provides objective feedback that accelerates transformation. Measurable data turns subjective experience into quantifiable progress across five critical dimensions.

1

Objective Progress Validation

See real-time proof of your internal state shifts through biometric data. No more guessing whether practices are working—measurable coherence scores validate your progress objectively.

2

Accelerated Learning

Immediate feedback speeds up skill development. When you see your coherence score rise in real-time, you learn faster which practices create optimal internal states.

3

Pattern Recognition

Track trends over time to identify what triggers stress versus coherence. Historical data reveals patterns you might miss through subjective awareness alone.

4

Sustained Motivation

Visible progress maintains commitment to practice. Watching your metrics improve week over week provides tangible evidence that your efforts are creating real change.

5

Accountability & ROI

Demonstrate transformation to stakeholders with quantifiable data. Corporate programmes can track team coherence and link biometric improvements to performance outcomes.

Frequently Asked Questions

Common Questions About Performance Tracking

What equipment do I need to track my performance?

We recommend HeartMath® biofeedback devices that measure heart rate variability and coherence. These connect to your computer or mobile device via Bluetooth. The Inner Balance sensor clips to your earlobe and provides real-time feedback. While not required, these tools significantly accelerate progress by making internal states visible.

How often should I track my metrics?

Daily 15-20 minute coherence training sessions provide optimal data. Track during morning practice to establish baselines, then spot-check during high-stress moments to see real-world application. Weekly reviews of trend data reveal patterns. Monthly assessments show long-term progress. Consistency matters more than duration.

What metrics does the dashboard track?

The dashboard tracks heart-brain coherence scores, heart rate variability (HRV), stress recovery time, emotional regulation patterns, and coherence duration. You'll see real-time graphs, historical trends, achievement milestones, and comparative data. Corporate dashboards add team coherence metrics and aggregate performance indicators.

Can I share my dashboard data with coaches or teams?

Yes. Individual dashboards can be shared with coaches for personalised feedback. Corporate programmes include team dashboards that aggregate anonymised data to show collective coherence trends. Privacy controls let you choose what to share. Export features allow you to download reports for stakeholder presentations.

How long before I see measurable improvements?

Many people observe coherence score improvements often in early sessions as they learn the technique. Consistent daily practice typically shows Observable HRV changes often within 2-4 weeks. Sustained behavioural changes and stress resilience improvements become evident in 6-8 weeks. Deep pattern transformation unfolds over 3-6 months of consistent practice.

Get In Touch

Quick Enquiry

Ready to explore how we can help transform your leadership? Get in touch.

Location

Fourways, Johannesburg